Grafana
Grafana is an open source analytics & monitoring program that works with lots of databases.
Its main features are real-time monitoring and alerting through graphic panels and dashboards.
Deployment
I installed Grafana in a CentOS 8 container with the following commands.
yum install wget
yum install initscripts urw-fonts
wget https://dl.grafana.com/oss/release/grafana-6.7.1-1.x86_64.rpm
sudo yum install grafana-6.7.1-1.x86_64.rpm
systemctl enable grafana-server.service
grafana-server
Its config file is located at /etc/grafana/grafana.ini. The default configuration is enough because I’m going to do further changes in the GUI.
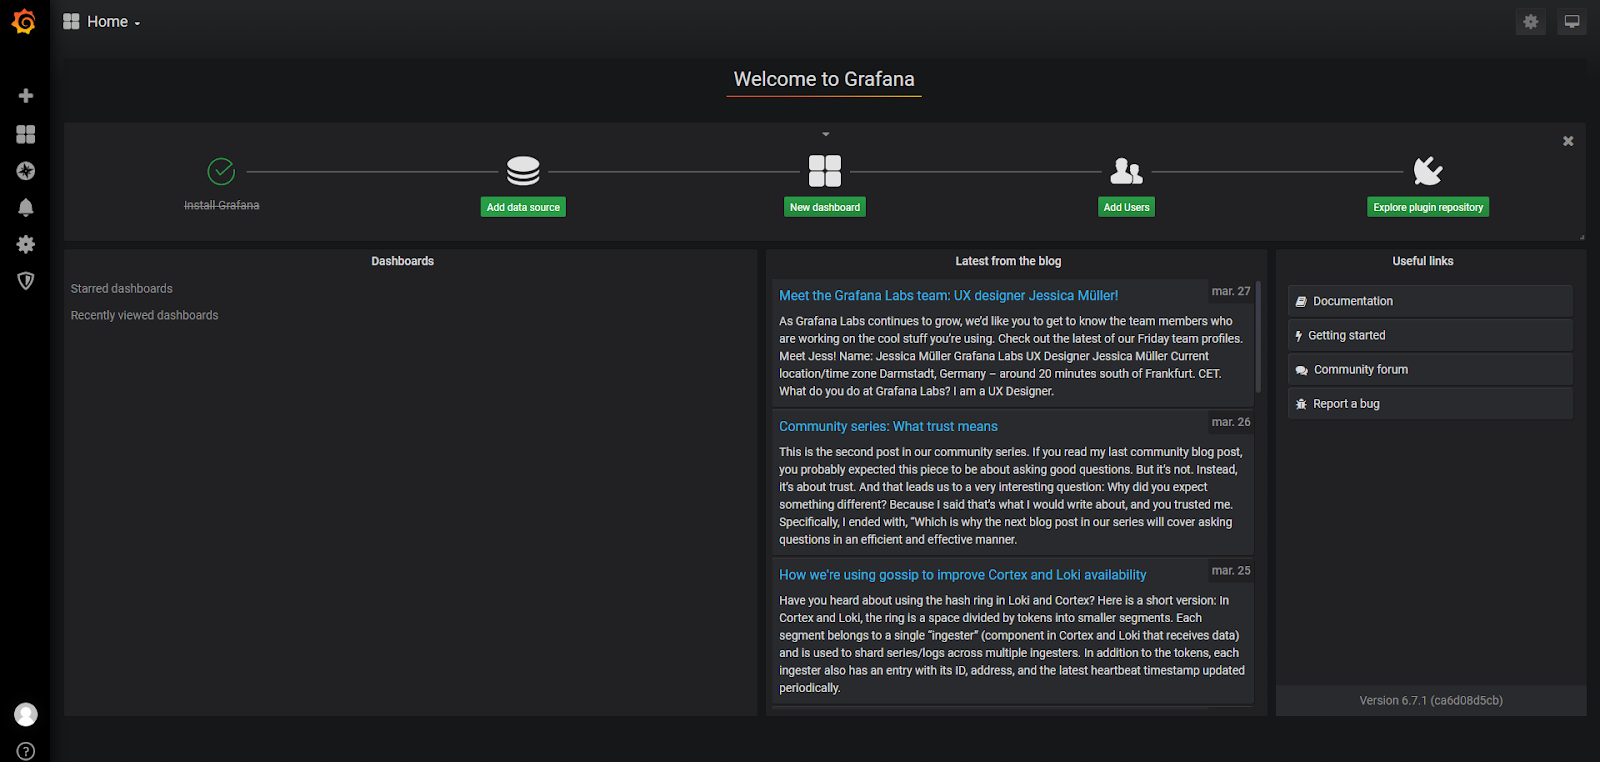
Accessing the Grafana pannel is easy as typing the socket address in the browser with the port 3000 and login.

Then it will appear a page with a web-based wizard.
First thing to do is configure the data source clicking on the Add source button.

Then select InfluxDB and configure it as it follows.

If the configuration is well done the data source will be working.

Finally create a new dashboard hovering on the + icon.
Dashboard
The dashboard I created features 54 different pannels. Explaining them one by one would be useless so I’m just going to explain the basics.
Settings
The dashboard settings can be accessed clicking in the gear placed on the top right corner of it.
In the general tab the following features can be configured.

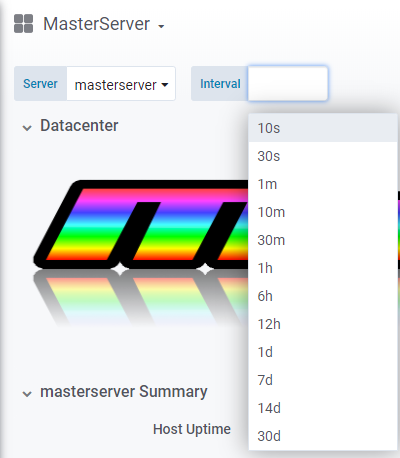
In the variables tab I set the $server variable to display the name of each Proxmox host.
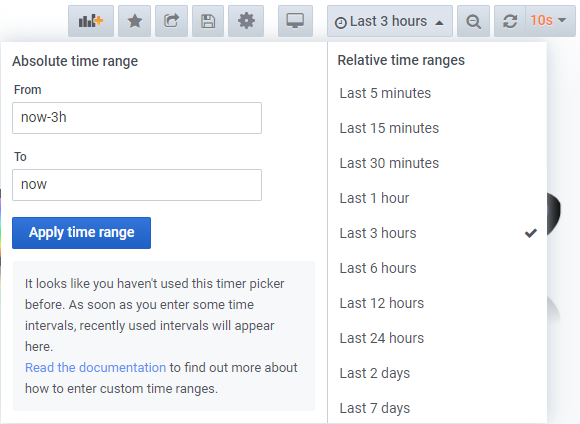
In case the server is expanded that variable will be useful. The auto-refresh rate is set to the same value as the $__interval variable, which is going to determine how often is InfluxDB queried.

Users can change the server and interval variables value through the dashboard, as well as the refresh-rate and time range.
Panels
The Dashboards basic element are panels. Each panel is a graphic display of single or multiple metrics.
There are many ways to display them.
Queries
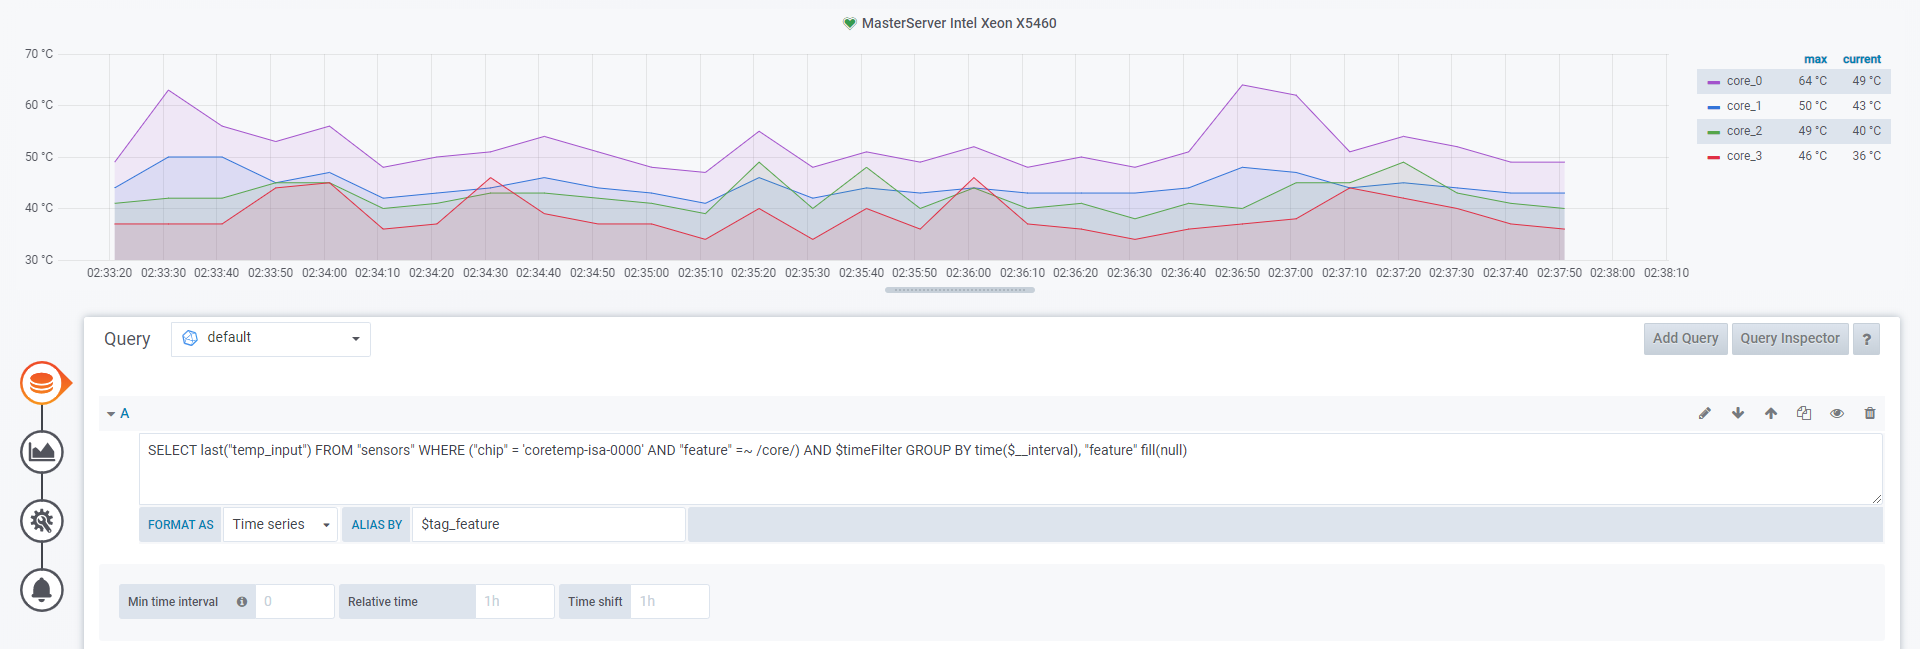
Displaying metrics is done by querying InfuxDB. Grafana features a query inspector which is handy to overview the measurements available and tags. Other than that I dont advice it for querying since it’s made for people without database knowledge; The text edit mode lets me write the queries manually. It can be toggled clicking on the pencil icon above the query box.
Each panel also can manage multiple queries, named starting from A
The whole stack is set to send data each 10 seconds which is a good value for a server like mine.
To control how often Grafana queries data to InfluxDB I used the GROUP BY time() clause. Also I set the clause value to the variable $__interval so people can change the time spacing for the queries starting from 10s with the interval dialog box, which must be the same as the refresh rate of the dashboard. That’s a more intelligent way instead of setting a fixed interval when it comes to analyzing data over time ranges, which can be set in the time interval dialog box.
I always format it as time series since im working with time series data. I used the alias by parameter set to the variable default variable $tag_feature for multi-feature metrics, so when I group them the displayed name of each one will be the right one.
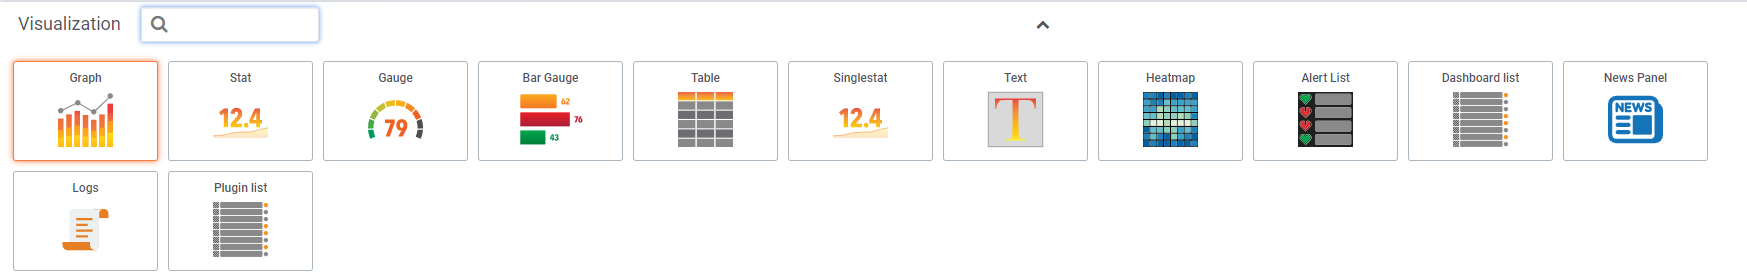
Visualization
Depending on the kind of visualization used different features will be available. Taking a graph visualization as an example, I can display it in points, bars or lines and toggle the differents axes along with the measurement unit and precission that fits my needs.
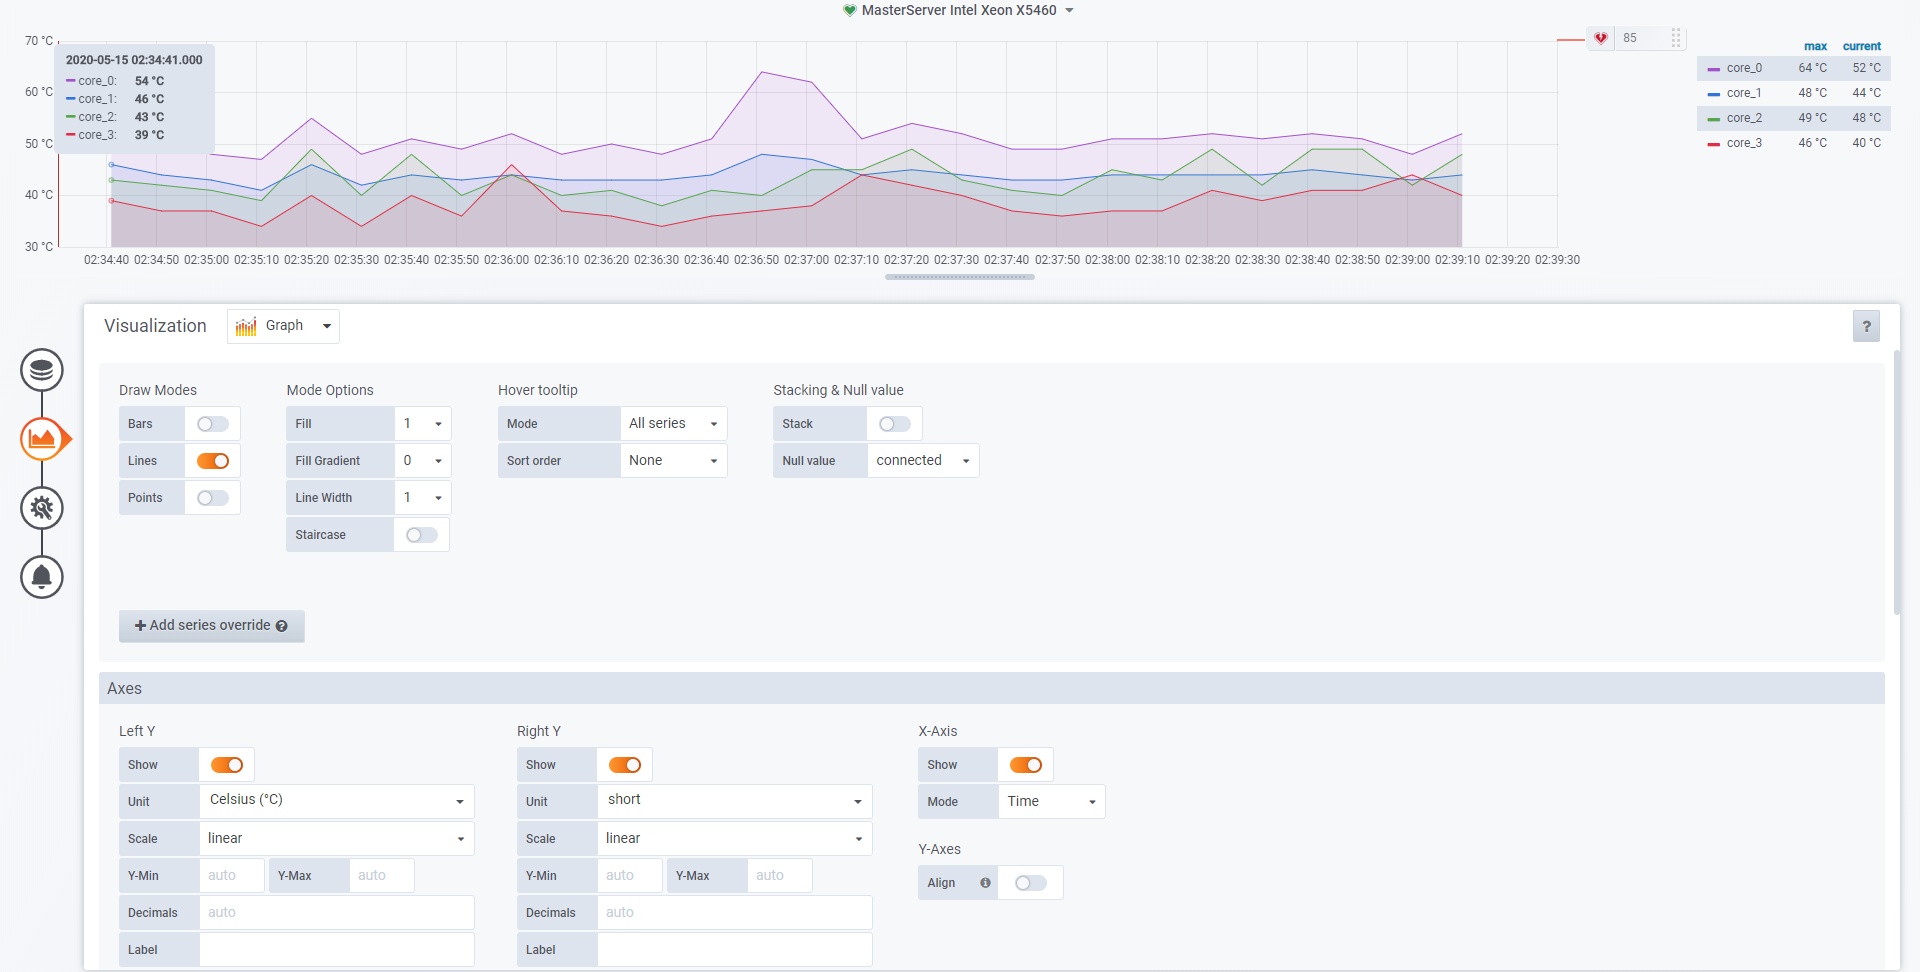
Also I can toggle legends and the way they are shown in the panel. Extra values like the max or current value can be also displayed on the legend.
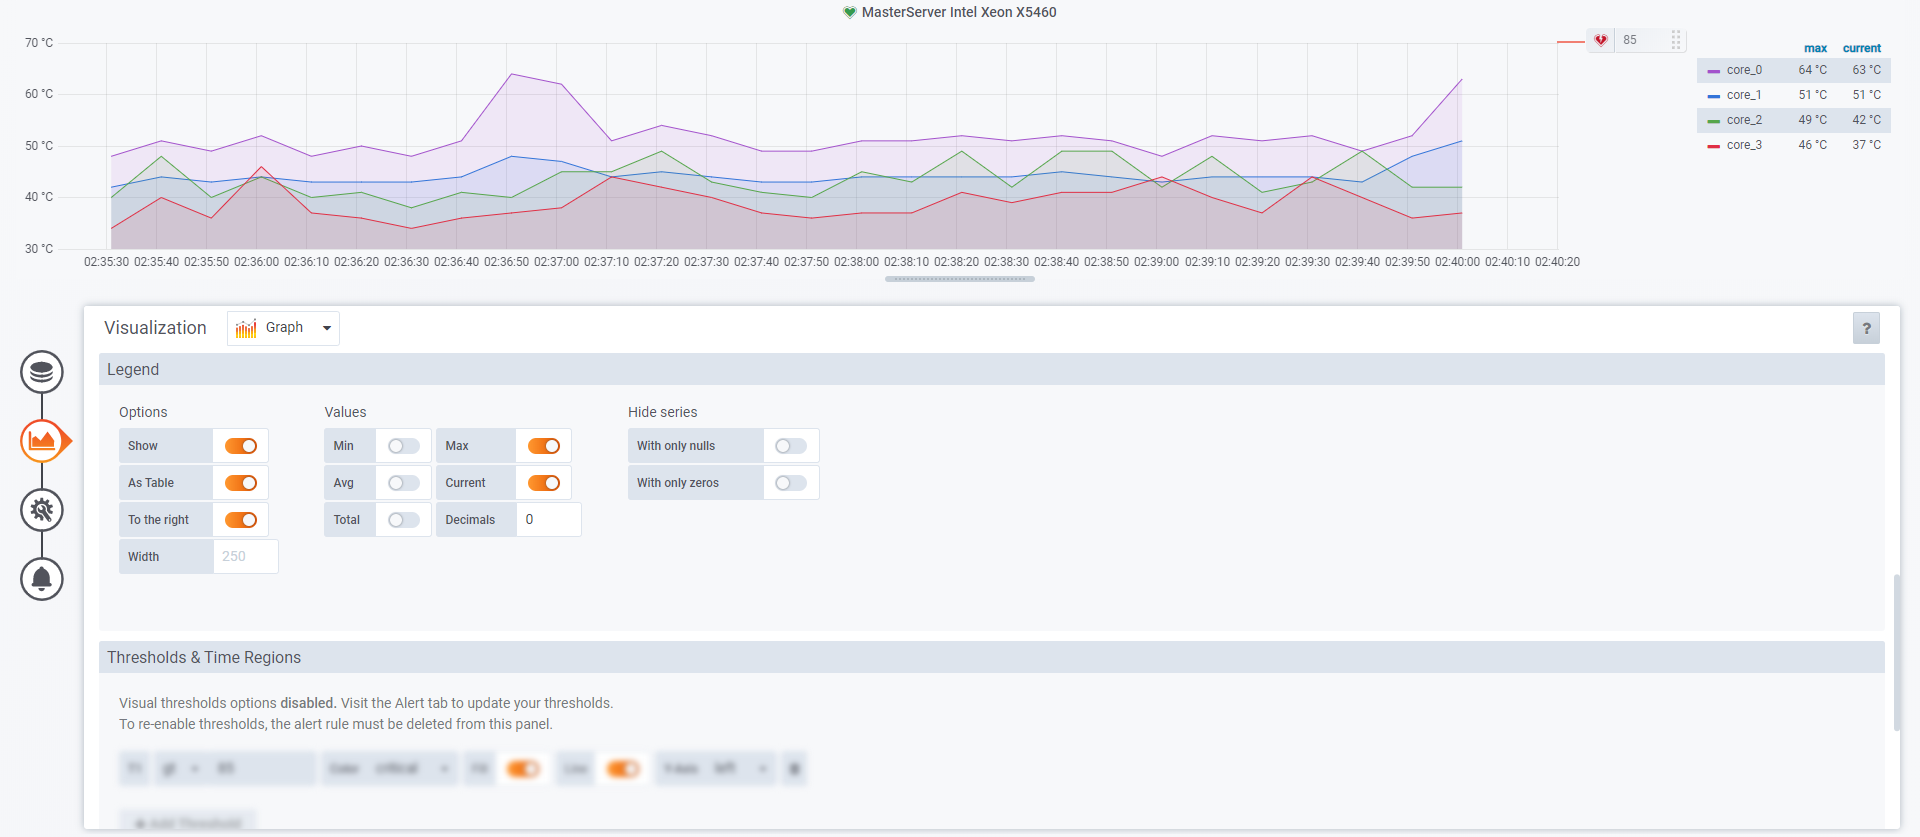
Thresholds and time regions can only be toggled if no alarms are set for the panel, which in this case I didnt use.
General
Here the title and repetition pattern can be specified. Also it can be set to transparent. I didnt use panel links since it’s the only panel used.

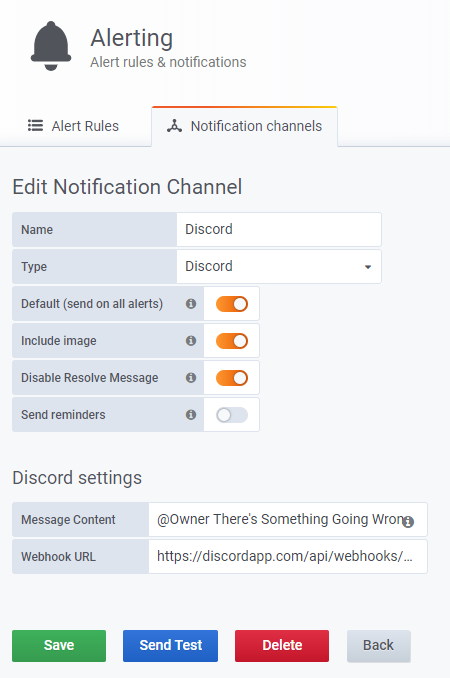
Alert
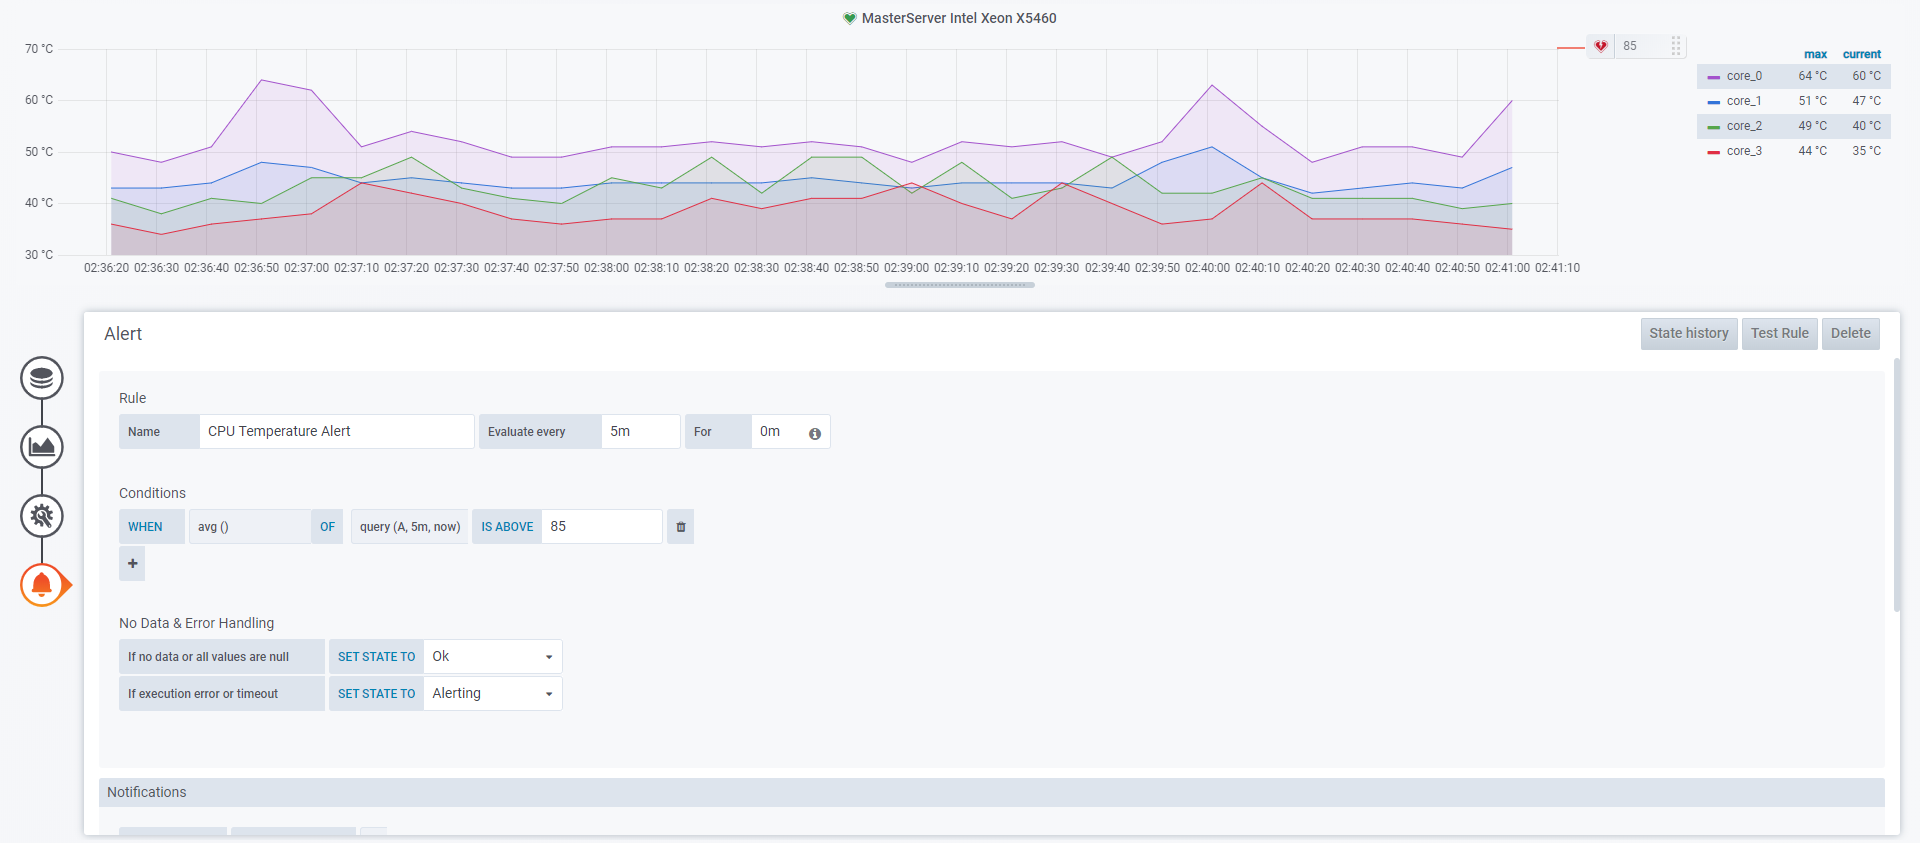
This takes monitoring a step further. Alarms can only be set on Graph panels. Every alarm has its own name and custom notification. The triggering timing is done playing with the evaluate every and for parameters, the condition specifies the requirements that the graph must meet to trigger the alarm.
The no data and error handling parameters specify the alarm state that will be set when theres no data and when the alarm is triggered.
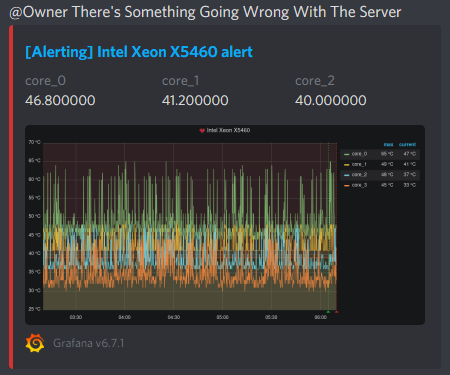
In this example, when the average CPU temperature goes above 85 degrees it will activate the trigger. If the CPU temperature stays above 85 ºC for at least 5 minutes, an alarm will be sent to the Discord server and displayed in the alarm panel of the dashboard.
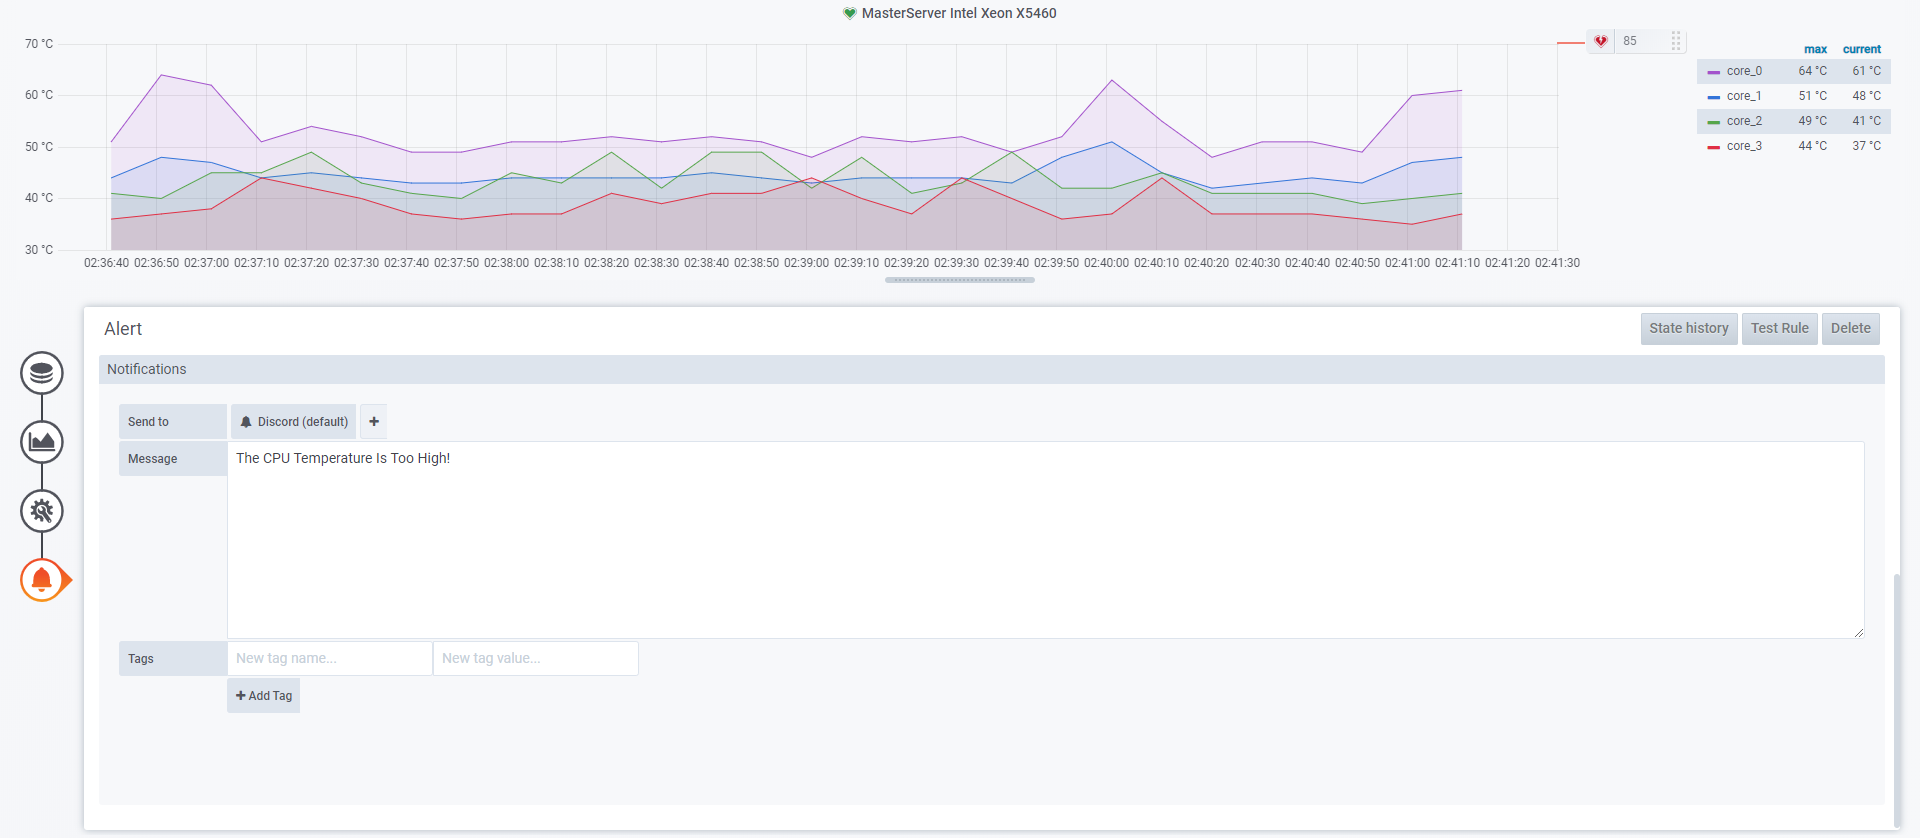
Alerts notification channels and rules configuration can be done accessing them from the left navigation bar. I set the notification channel to the Discord server through a webhook. It will include an image of the alarm as well.